Friday, September 21, 2007

Soda Review: Mt Dew Game Fuel


I don't drink beer, and I don't drink coffee. Both invite the discussion and comparison of various new versions or flavors. I do get 100% of my caffeine from soda. In college I was well versed in every knock off brand of soda that could be bought for under $.75 per 2 liter. When I graduated and got a job I told myself I would pay up to get real Coke etc.

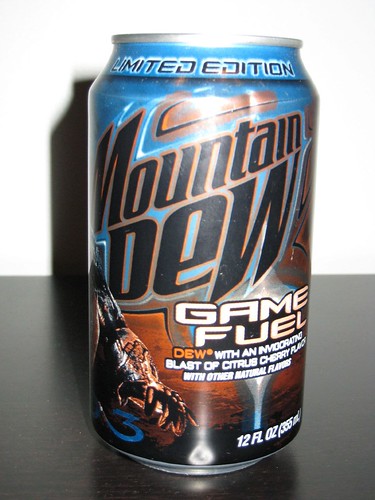
I also don't play xbox 360 or Halo 3. But at Target today Zach and I decided to try the new Mountain Dew Game Fuel, a soda co branded for Halo 3 "Gamers".

It is ironic that it is for Halo 3 because I would give it a 3 on a scale of 1 to 10. That would put it just above Cott Black Cherry, which Vishad provided free to the Engineering lab as long as you were a member of the engineering society, AIChE. It will also put it just below "Splash it Up" (think 7 up) which I think was $.59 per 2 liter circa 1998 and almost as good as "Seventeen".

Based on my professional soda drinking expertise, I would say Game Fuel is 1/2 Mt Dew Code Red and 1/2 Mt Dew Live Wire. But they did seem to add some other necessities like glycerol ester of wood rosin and 73 mg of caffeine. It is so bad you probably need to run out and try it. With only 2 gone of our 12 pack, there is a good chance I will offer you some next time you are at the house. But don't panic the odd after taste is probably a result of the brominated vegetable oil.

I cannot confirm if this Limited Edition soda was just a process mistake like the rumors around OK soda back in 1994.

OK Soda Wikipedia

Wednesday, September 19, 2007

Global Dimming 3

So far, the Global Dimming blogs have been brought up quite a bit offline.
I enjoy knowing nothing about a subject and learning as I go (hence 'Learner' from my discover your strengths tests).

I need to learn more about photosythesis and what controls it:
A general equation for photosynthesis is:
6 CO2(gas) + 12 H2O(liquid) + photons → C6H12O6(aqueous) + 6 O2(gas) + 6 H2O(liquid)
carbon dioxide + water + light energy → glucose + oxygen + water

1. What impact does moisture, temperature, and light have on the reaction?
2. Most interesting and hard to learn about is how reversible is the reaction?

When the leaves fall, plants release CO2 back into the air. How efficient or inefficient is this? Converting the carbon into sugar seems like a good way to to get rid of it, but how does it re-release CO2 from the decomposition of the leaves? Does 100% go back into the air or 90%?

Another interesting affect that I found was Ocean Acidification.

Average surface oceanp pH
Pre-industrial (1700s) 8.179
Present-day (1994) 8.104
2050 (2×CO2 = 560 ppm) 7.949
2100 (IS92a)[3] 7.824

As we produce more CO2 and the ocean temperatures rise we will increase the solubility of CO2 in the ocean. This lowers the pH of the ocean.

"When CO2 dissolves, it reacts with water to form a balance of ionic and non-ionic chemical species : dissolved free carbon dioxide (CO2 (aq)), carbonic acid (H2CO3), bicarbonate (HCO3-) and carbonate (CO32-). The ratio of these species depends on factors such as seawater temperature and alkalinity."
- wikipedia


This is a plot (tanks wikipedia) of the change in CO3- concentration from 1700 to 1990.

What is interesting is if you look back at the Keeling Curves (CO2 plots). I ran some quick trendlines for the rate of CO2 increase at Hawaii and at the South Pole. The rate of CO2 increase at the South Pole is slightly less than that at Hawaii. This could be caused by the southern hemisphsere having more oceans than land (unlike the norther hemisphere) increasing CO2 absorption by the Ocean slightly decreasing the rate of CO2 increase in the south.

I'll post my plots at some point, they are currently on the Nursing School Laptop.

Thursday, September 13, 2007

Thursday, September 6, 2007

Global Dimming: Part 2

I have now been emailing the professor at Columbia back and forth.
Here are some of his comments:

Dear Dave,
This is very interesting! I have looked at some specific sites and the
effect of dimming on photosynthesis, but I have not thought about it the way you show it with the keeling curve. Did you try other years as well or did you choose 1960 and 2006 because they are the first and the last?
I am curious and will show it to my colleagues.
Thanks for helping us with our daily science struggle.

Dave,
It becomes more interesting. You may already know that the Keeling data from Hawaii represent Northern Hemisphere biospheric productivity because CO2 is well mixed in the Pacific air mid troposphere. Although major forest fires or extended droughts can affect one year but a general trend is indeed relevant for climate change. Current thinking is that the biological uptake of CO2 in a warming world is reduced which implies a positive feedback (more man-made CO2 produces even more natural CO2). But I have never seen anything with regards to the changes within seasons as you show it. I have to do some more literature search and think about it more carefully.
It is VERY intriging.

-----
As I dug in for more supporting data I found this:

Before 1980 the Month of the Min CO2 levels (trees start to die)
27% in Sept
73% in Oct

Since 1980:
77% in Sept
23% in Oct

Since 1987:
90% in Sept
10% in Oct

There is some possible data that the year after a big Volcano eruption the trees die earlier but I'd need to see daily CO2 values to really show a good chart.

But I did find some data on the New England Foliage season. It is only since 1999 but we have been talking for years that it seems like it comes earlier these days.

When Rachel and I went to Vermont a couple of years ago it was the first weekend of "Foliage Season Rates" at the B&B. But most of the area was at or past its peak.


OK only 7 years but it shows some earlier foliage. At least still interesting.

My next big question is if the leaves change a few weeks earlier than before, how does that impact the amount of CO2 trees could be taking out of the air?

Tuesday, September 4, 2007

Scientific Contribution

Another great Nova special on tonight about how pollution could be causing a dimming of sunlight reaching the earth, decreasing the impact of global warming and causing huge issues with weather patterns.

Global Dimming

It made me go back and look at a problem that has been bothering me since Rachel and I first watched An Inconvenient Truth (A+).


The Keeling Curve (wikipedia)


The Keeling Curve is the plot of the levels of CO2 in the atmosphere over time. As you can see it has gone up steadily since 1960 helping to lead to the idea that global warming can be caused by greenhouse gases.

You can also see the data swings up and down within a year. It hits its peak CO2 levels in the spring because that is when the all the leaves come out and start abosrbing the CO2 from the air (good work plants). And begins to rise in the fall when leaves begin to die and the decomposition releases the CO2 back into the air. An important note is that this trend lines up with our seasons here in the North (sorry Australia) because about 3/4 of the total land mass is above the equator.

What has bothered me since watching An Inconvenient Truth is a shift in the calendar year of when the peaks and lows are reached. I started plotting the data, laying the curves of an early year (1960) over top a later year (2006). I personally expected to see a shift in the seasons due to an increase in Global Warming. I thought we'd see the peak CO2 leves be reached earlier in the year (as it got warm earlier for plants to grow) and also the min to be reached later in the year as global warming extened the nice weather in the fall (how great has it been around Halloween?).

I was wrong. (Well only half right).


The Pink line is 1960 data and the Blue line is 2006 data.
As you can kind of see the peak shifts a bit to the left (earlier in the calendar year) going from 1960 Pink to 2006 Blue. This fits well with Global Warming causing an earlier snow melt up north (Canada) and starting the growing season that produces CO2 absorbing leaves.
What has driven me crazy for 6 months is the fact the I was wrong in the Fall. This shows that the Min of CO2 levels is also shifted earlier in time. This means despite possibly warmer weather, trees are losing their leaves earlier (my parents said the leaves are already turing in Boston).

How can this be?

This can be true because of 2 reasons.

1. I suck at biology.

Plants do not lose their leaves due to temperature. They lose their leaves due to a decrease in photosynthesis caused by reduced light. Normally the huge drop off in daylight should occur around Sept 21st (the equinox). But IF Global Dimming were true, this could occur earlier in the year due to pollution reducing light stopping photosynthesis earlier.

2. Global Dimming could be real.

I have seen another PBS special that says we can now measure pollution in Seattle that has made it all the way across the Pacific from China.

What is exciting to me, is that I may have found (am I the first?) pre-existing evidence of Global Dimming in historical data. In the Nova special it was presented as a theory with some evidence it may have decreased ocean temperatures enough to change rain patterns. I emailed some of my charts and thoughts to a professor from Columbia and one from U Wisconsin - Whitewater who were mentioned in the Nova special.

Is any of this legit? I don't know, but it was a lot of fun to work on. And I can sleep a bit better with at least a theory as to why the data drove me crazy for months.